An advanced Power BI project analyzing how the COVID-19 pandemic affected 20 major U.S. companies across 7 sectors between 2018 and 2022 — combining stock market data, financial fundamentals, risk metrics, and an investor recommendation framework.
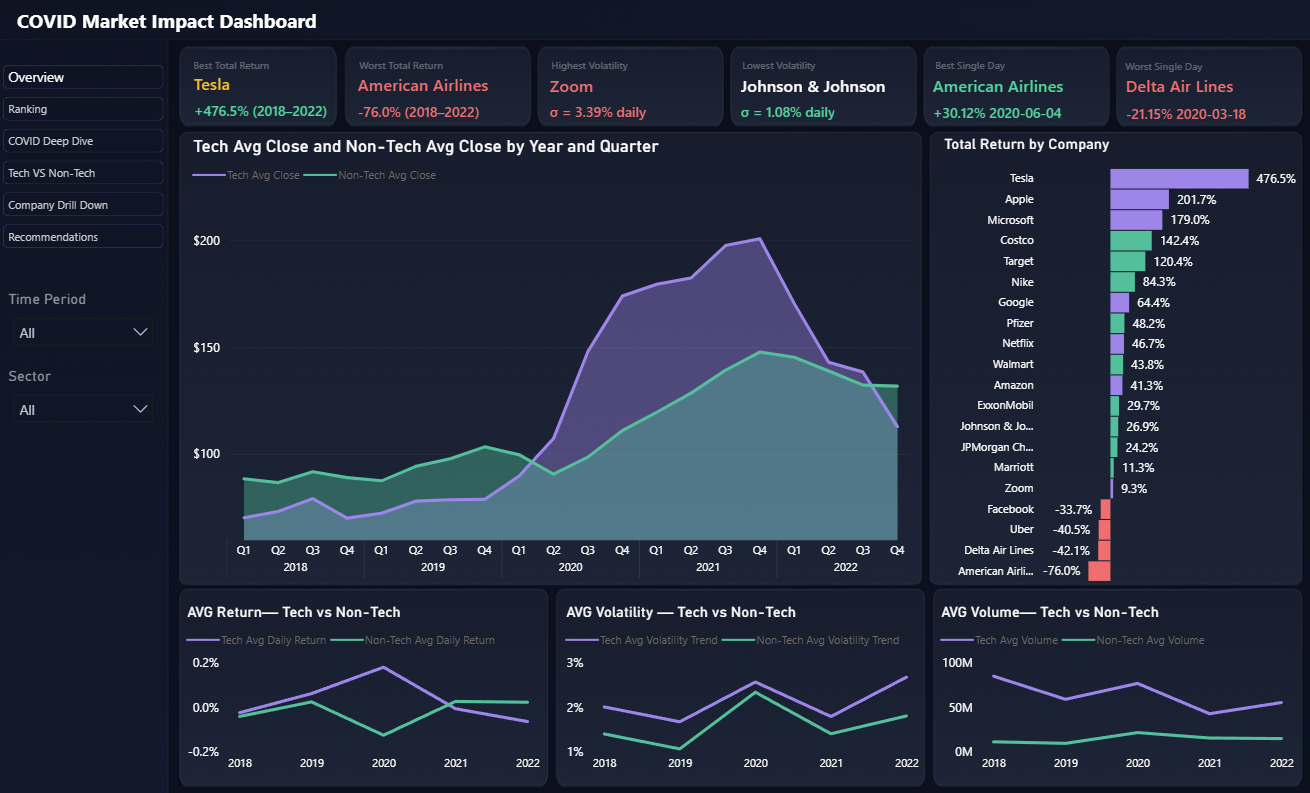
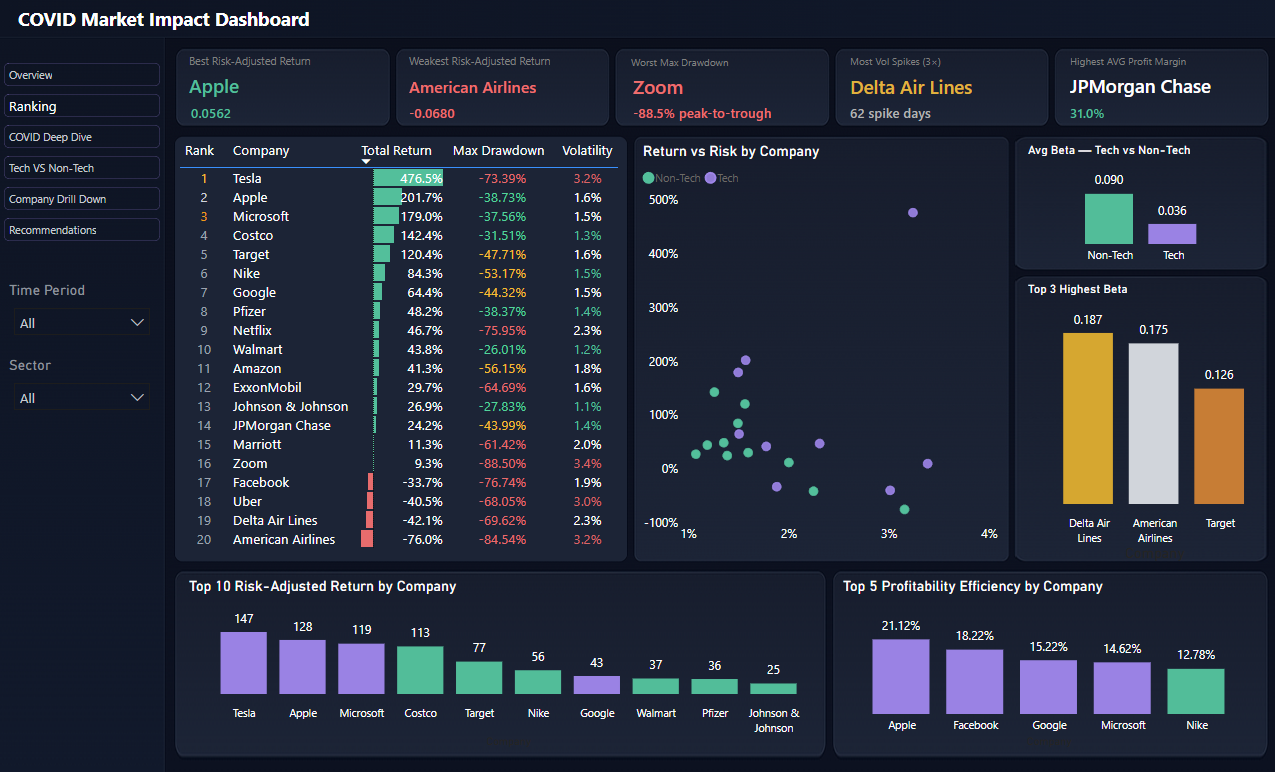
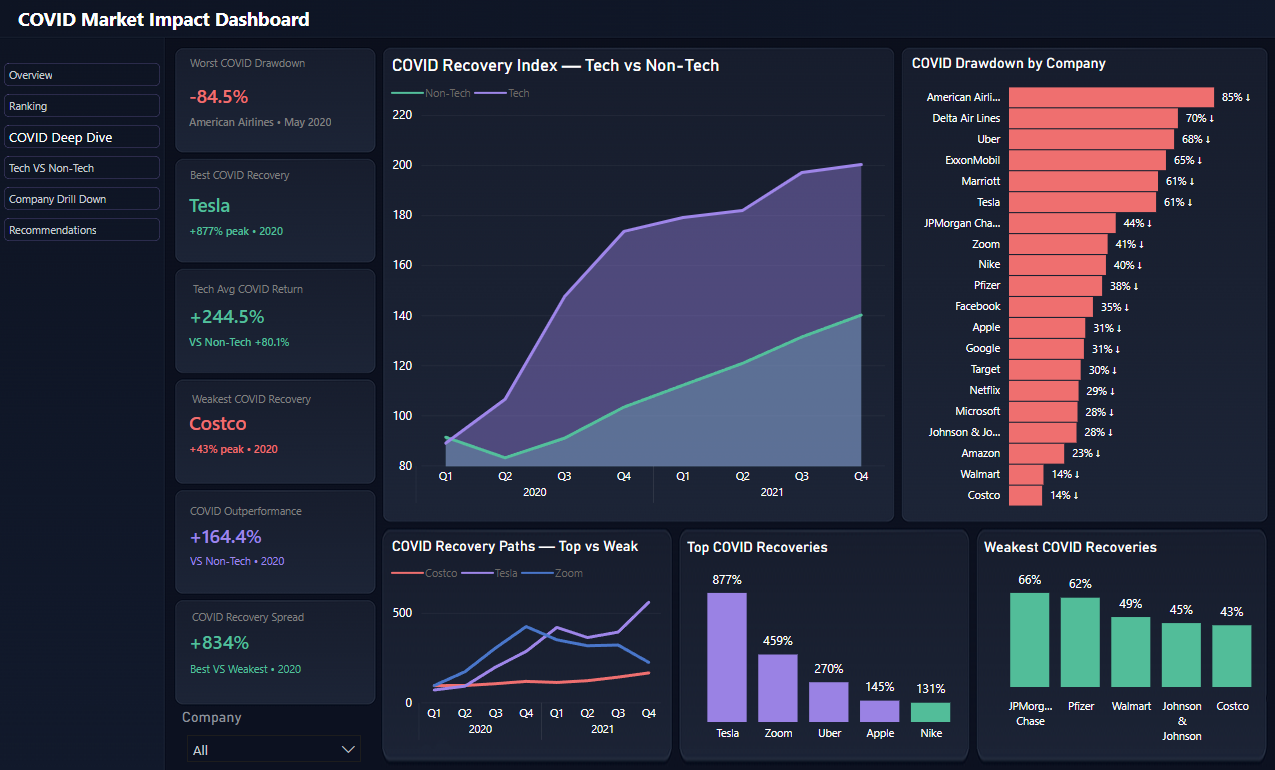
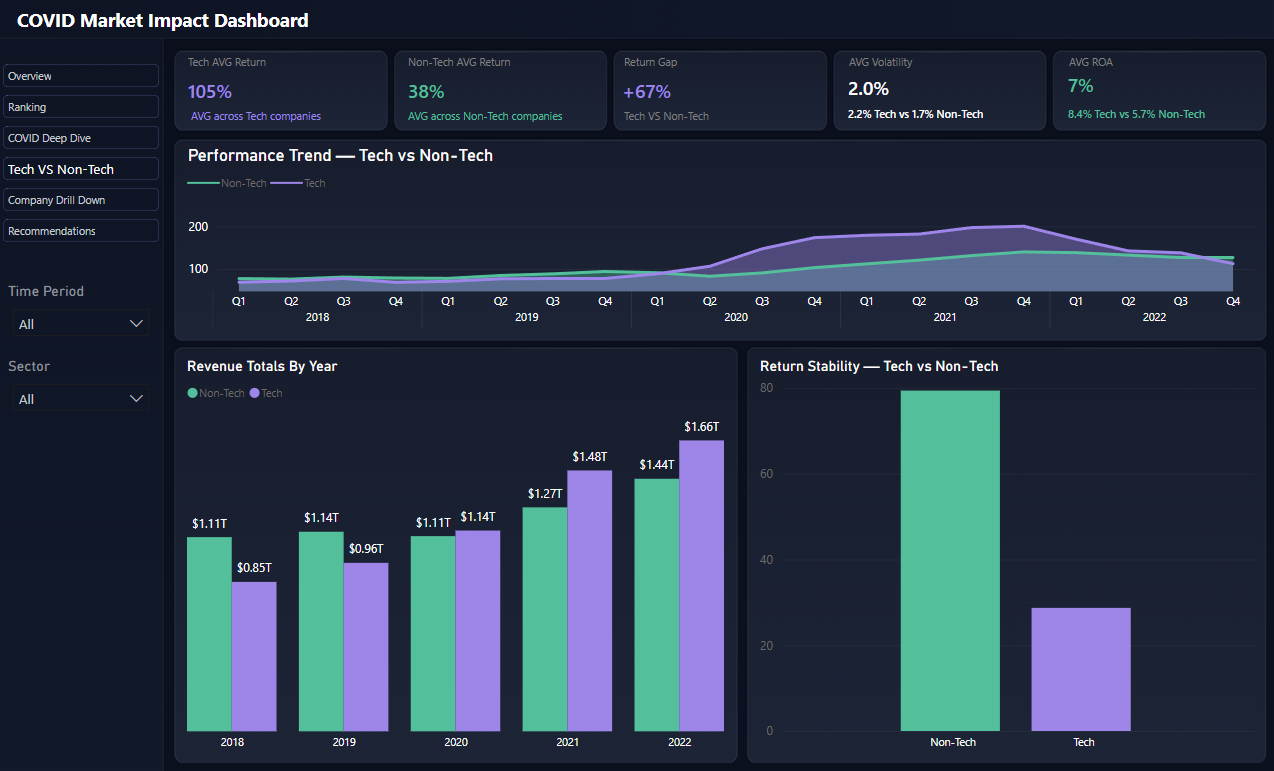
This project analyzes how COVID-19 disrupted U.S. financial markets using daily stock prices, company financial statements, market returns, and sector classifications for 20 leading companies across technology, healthcare, retail, finance, energy, transportation, and consumer sectors.
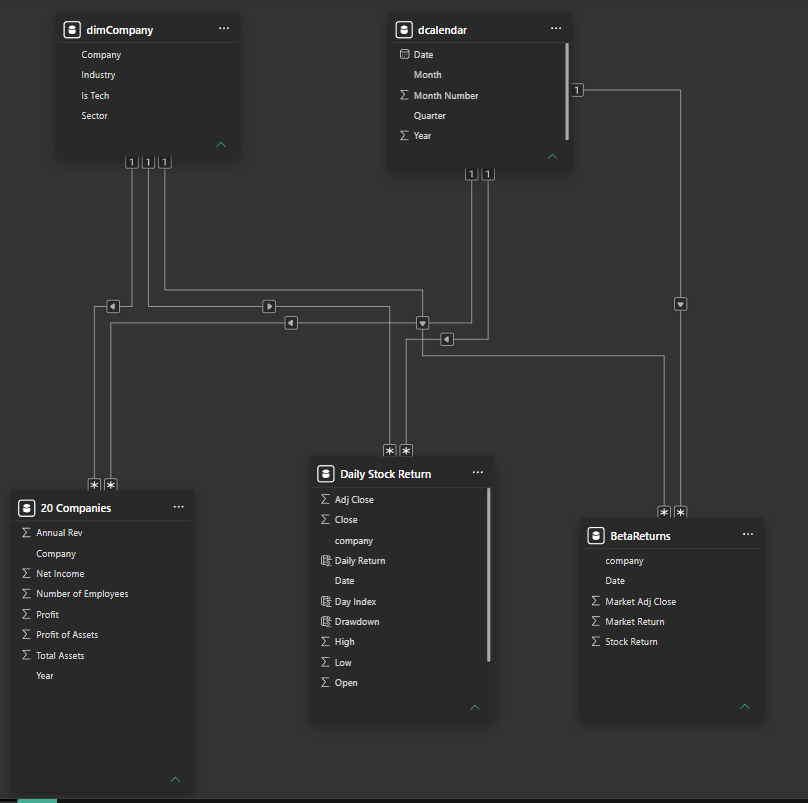
A star-schema data model was built with daily stock performance as the primary fact table, supported by company dimension, sector classification, market benchmark data (BetaReturns), and a calendar table for time intelligence. DAX measures cover total return, daily return, volatility, beta, Sharpe ratio, maximum drawdown, COVID recovery %, risk-adjusted return, ROA, profit margin, and revenue efficiency.
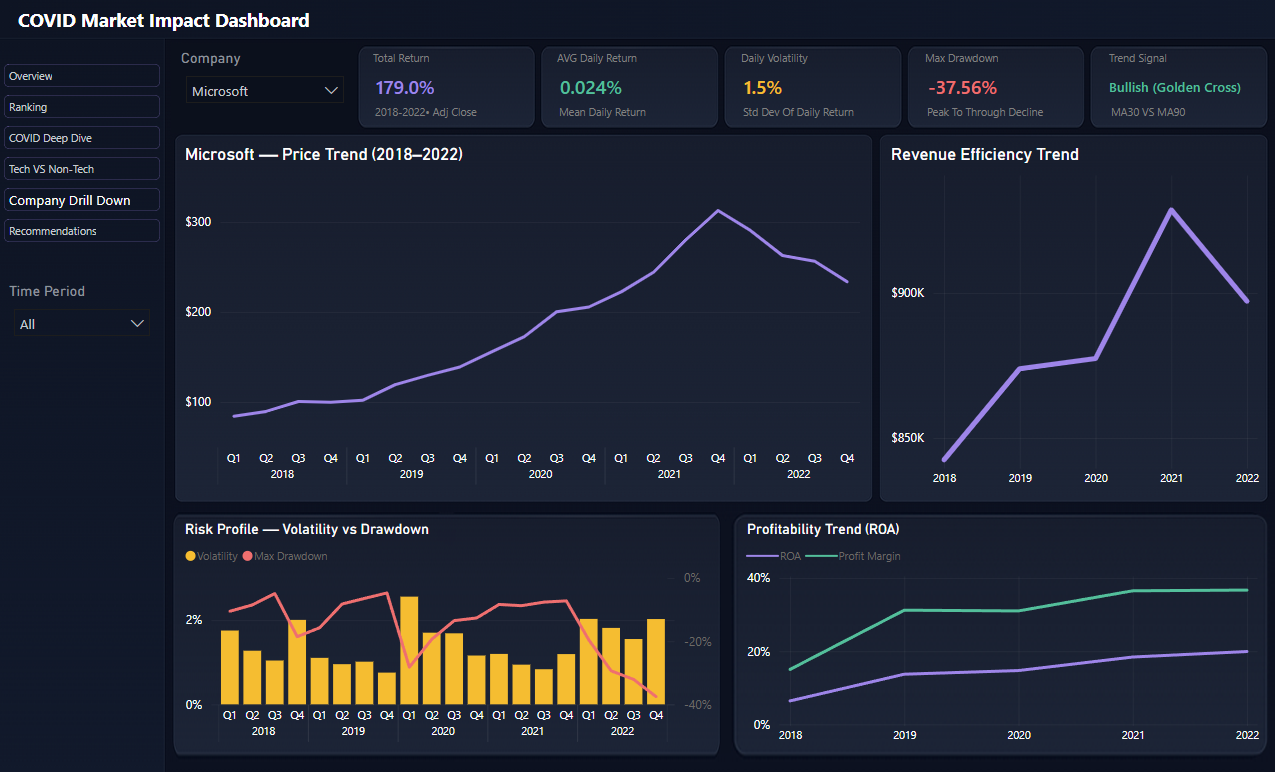
The dashboard is structured across 6 analytical views: Overview, Ranking, COVID Deep Dive, Tech vs Non-Tech, Company Drill-Down, and a Recommendations Center — guiding users from macro-level insights to individual company and investor-specific analysis.
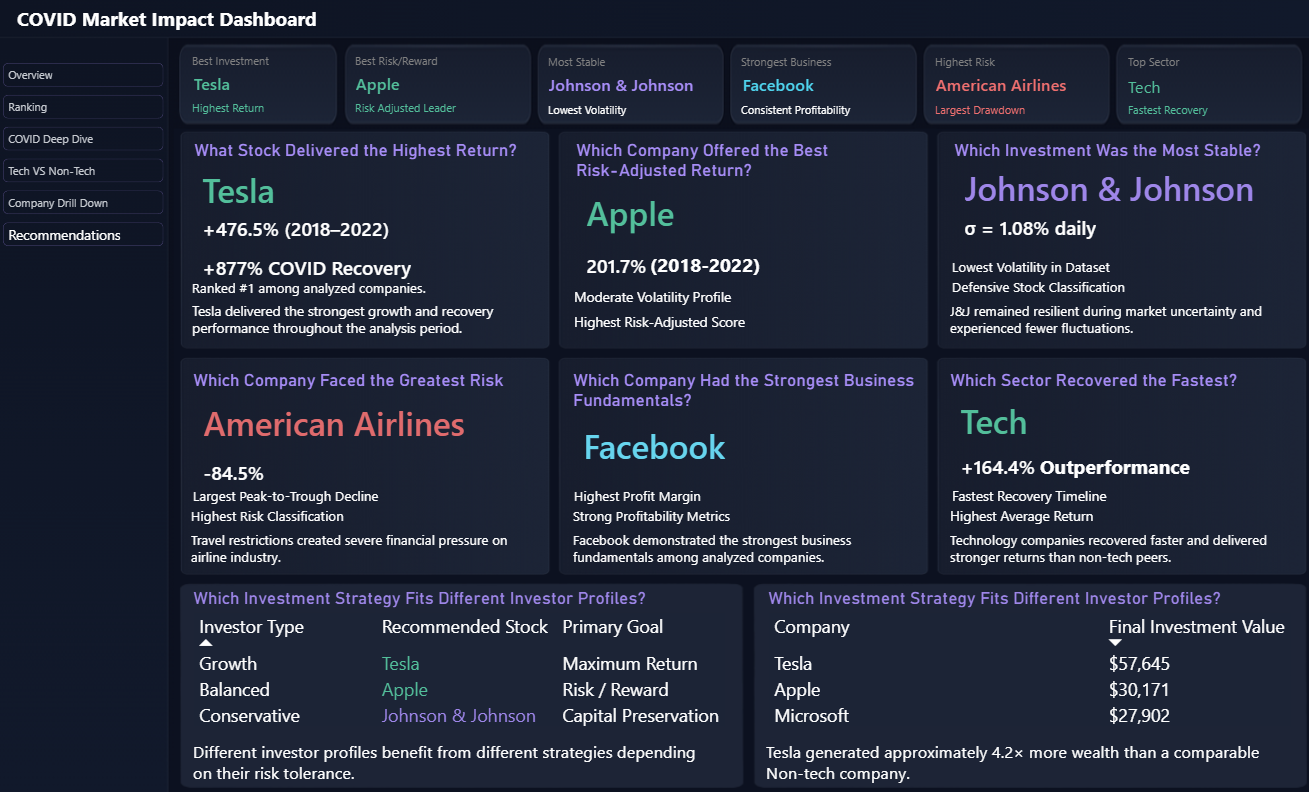
With +877% COVID recovery, Tesla ranked #1 across all analyzed companies — driven by EV demand surge and strong post-pandemic momentum.
With 201.7% total return and moderate volatility, Apple ranked as the strongest risk-reward investment across the analysis period.
Travel restrictions created severe financial pressure on the airline industry, with Delta Air Lines also falling -70% during the pandemic trough.
Tech averaged 105% vs Non-Tech at 38% — with +164.4% COVID outperformance and a faster recovery timeline driven by digital-first business models.
Growth investors: Tesla ($57,645 final value). Balanced investors: Apple ($30,171). Conservative investors: Johnson & Johnson (lowest volatility at σ = 1.08% daily).
Among all 20 companies, Facebook topped the profitability efficiency ranking — ahead of Google (18.22%), Apple (15.22%), and Microsoft (14.62%).