Transforming raw supplier and sales data into a structured BI model to analyze $9.68M in operational revenue, $4.02M gross margin, and profitability performance across 5 suppliers and 3 sales teams.
.png)
.png)
.png)
.png)
.png)
This project focused on transforming raw operational sales data into a structured analytical model to analyze revenue performance, supplier profitability, and gross margin trends using Power BI.
Multiple raw datasets were imported including product information, supplier data, salesperson data, and transactional revenue data. These required extensive transformation in Power Query — standardizing column headers, correcting data types, removing duplicates, and reshaping tables for relational modeling.
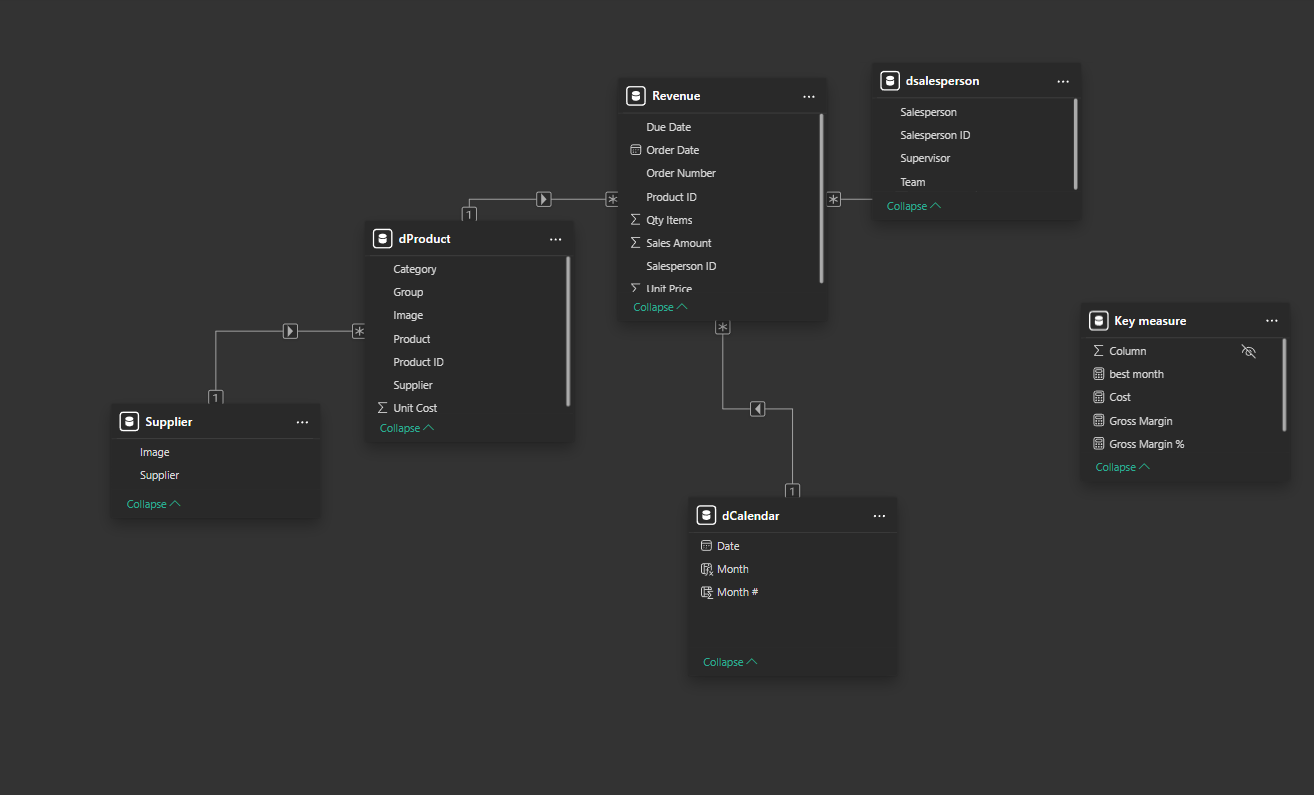
The data was normalized into a star schema with the Revenue table as the fact table and dimension tables for Product, Supplier, Salesperson, and Calendar. Query merging enriched the product table with supplier information and images. A Calendar table was created using DAX with date, month, and month number fields for time intelligence.
DAX measures were built to calculate total revenue, total cost, gross margin, and gross margin percentage — enabling profitability analysis at the supplier, product category, and team level.
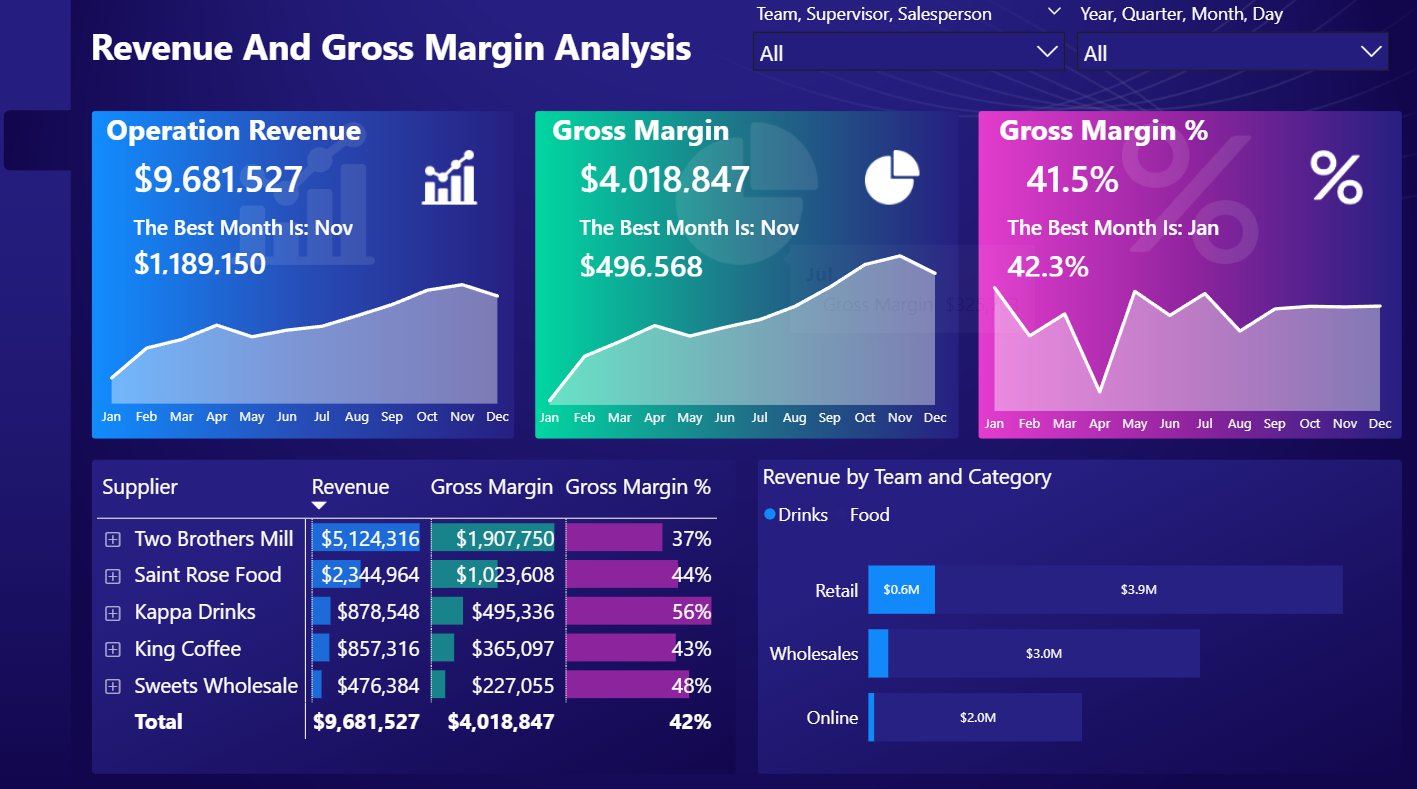
Despite the highest revenue, their margin was 37% — the lowest among all suppliers, flagging a profitability concern.
With $878K in revenue and $495K gross margin, Kappa Drinks was the most profitable supplier relative to its size.
Revenue peaked at $1.19M and gross margin at $496K in November, with January showing the best margin percentage at 42.3%.
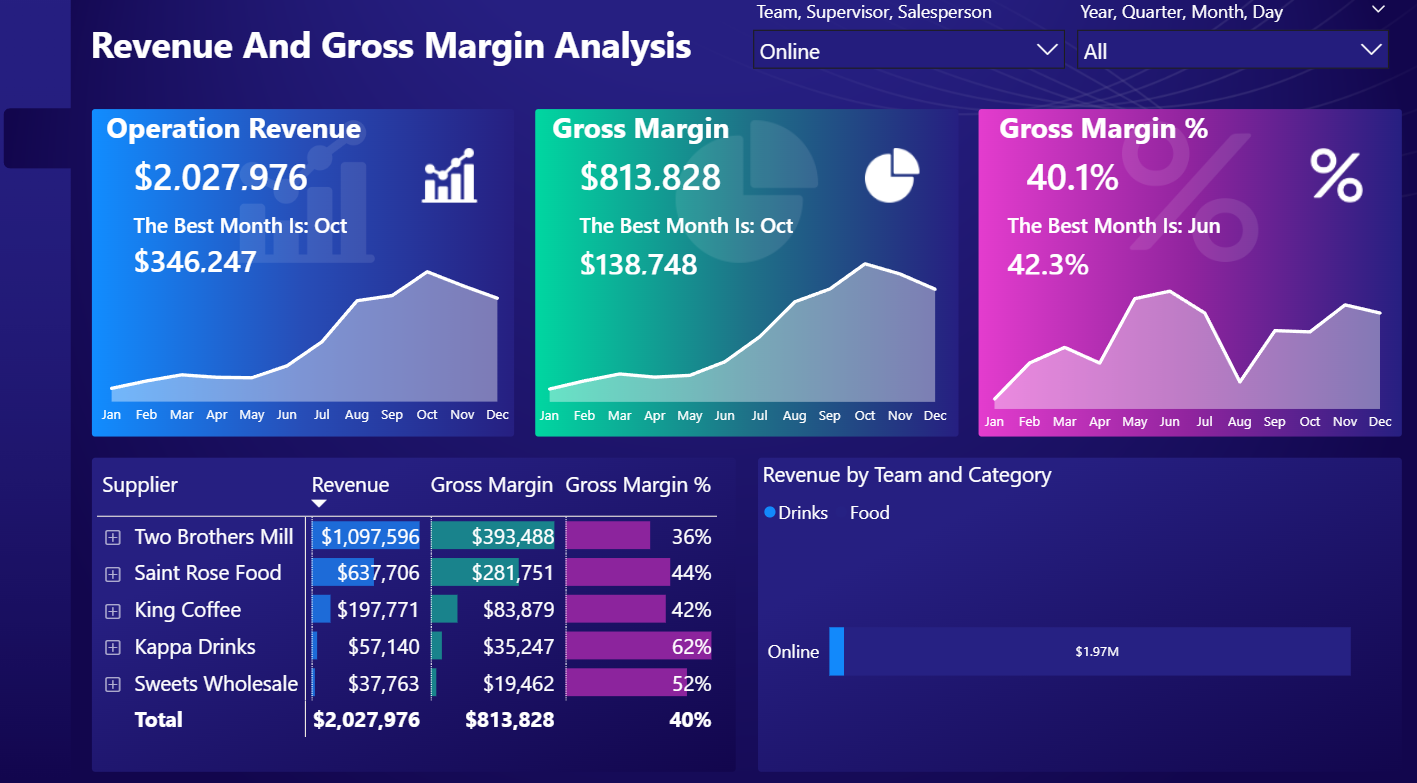
Revenue by team and category showed Retail dominating Food sales, while Online and Wholesales contributed across both categories.
By calculating cost from unit price and quantity, gross margin measures allowed comparing true profitability across suppliers — not just revenue volume.