Transforming raw operational data into a full star schema BI model with an interactive Power BI dashboard — tracking revenue, orders, and salesperson performance across 3 years.

.png)
.png)

.png)
.png)
.png)
.png)
.png)
.png)
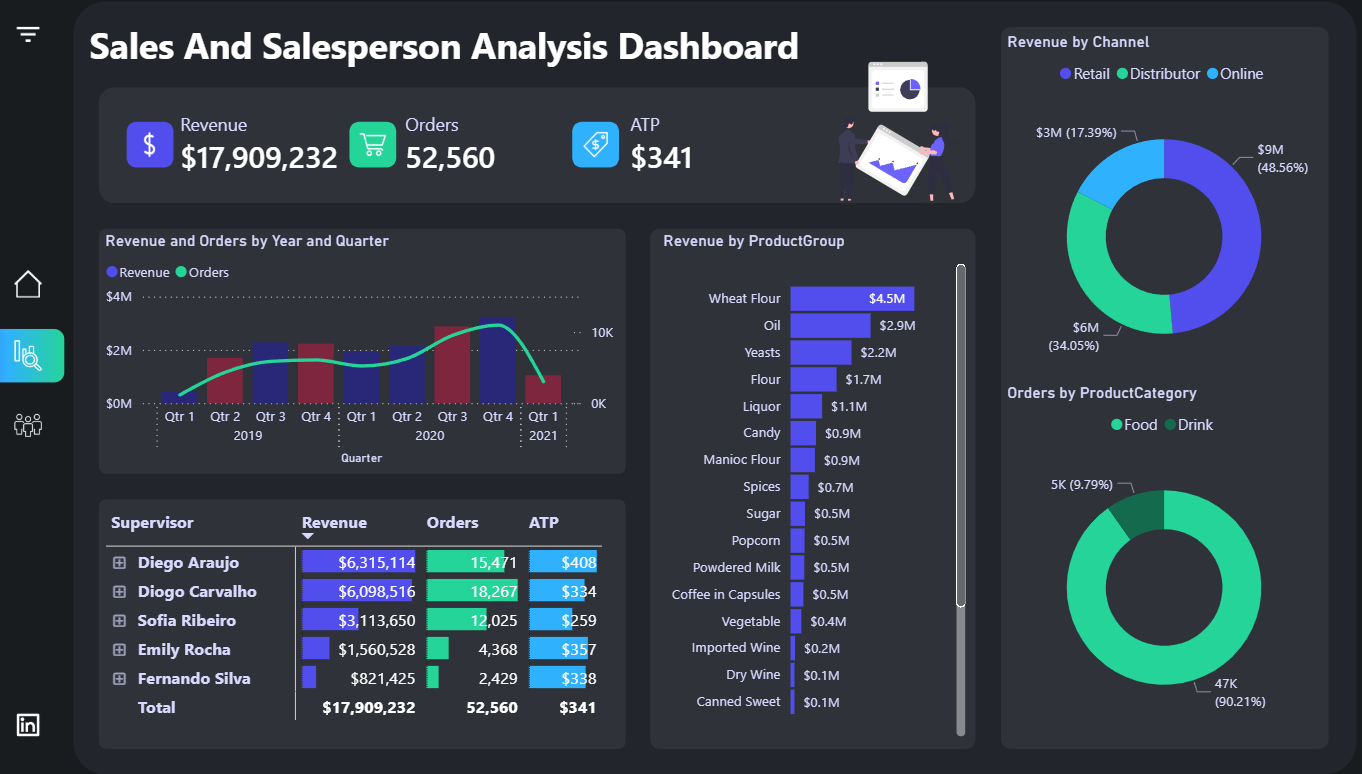
This project focused on transforming raw operational sales data into a fully structured analytical model and building a dynamic Power BI dashboard to analyze revenue performance, salesperson productivity, and product demand.
The data model was normalized into a star schema with the transactional Sales table as the fact table, supported by dimension tables for Products, Salesperson, Calendar, and Targets. All preparation was handled inside Power Query before loading into the model.
Several DAX measures were built to calculate key business metrics including total revenue, total orders, average transaction price (ATP), and salesperson achievement against targets — all dynamically responsive to filters and slicers.
Food category dominated at 90.21% of total orders vs. Drink at 9.79%.
Supervisor-level ranking revealed clear performance gaps, enabling targeted coaching decisions.
Channel split: Online $9M (48.56%), Distributor $6M (34.05%), Retail $3M (17.39%).
Time intelligence surfaced seasonal trends and a revenue dip in early 2021 requiring investigation.
Normalizing into 5 dimension tables eliminated redundancy and enabled efficient cross-filtering.