An interactive Power BI dashboard built to analyze volunteer applications, participation trends, engagement levels, and operational performance — transforming raw volunteer records into decision-ready insights for nonprofit stakeholders.
.png)
.png)
This project is an interactive Power BI dashboard developed to analyze and monitor volunteer data for a nonprofit organization. It provides a centralized view of volunteer applications, participation trends, engagement levels, and operational performance.
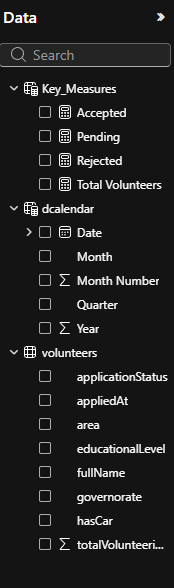
The dataset includes volunteer records such as full name, governorate, area, educational level, car ownership status, application status, application date, and total volunteering hours. Data was cleaned in Power Query by promoting headers, assigning correct data types, replacing inconsistent values, removing unnecessary columns, and standardizing date and numeric fields.
The data model was built with the volunteers table as the main fact table, a dcalendar table for time intelligence, and a Key_Measures table for DAX measures. A relationship was created between volunteers[appliedAt] and dcalendar[Date] to support monthly and yearly trend analysis.
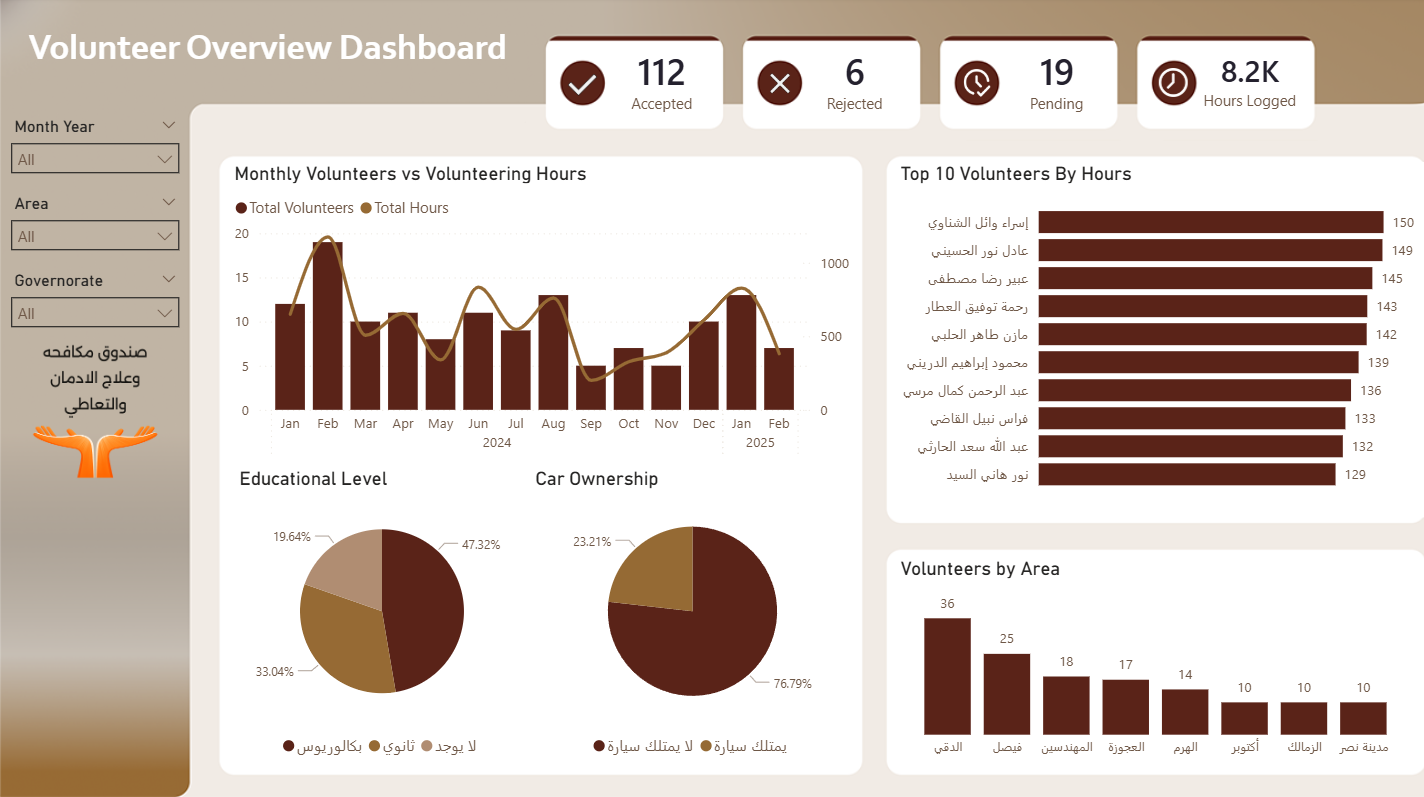
Custom DAX measures include Total Volunteers, Accepted, Rejected, Pending Applications, and Total Hours Logged — all dynamically responsive to slicers for Month/Year, Area, and Governorate.
KPI cards revealed only 6 rejections and 19 pending, showing a highly efficient intake process with minimal bottlenecks.
The monthly combo chart showed a strong early-year surge in applications, followed by a gradual decline through mid-year and a recovery in late 2024.
The Top 10 Volunteers by Hours chart identified the most active contributors, supporting volunteer recognition and performance monitoring.
Geographic distribution revealed strong concentration in Giza districts, while areas like Zamalek and Nasr City showed lower engagement — highlighting outreach opportunities.
Educational level breakdown combined with 76.79% car-less volunteers informs logistics planning and field operation decisions for the organization.